Homeowners Reinsurance Renewal Tracks Flood Map Revision Lag Across Three States
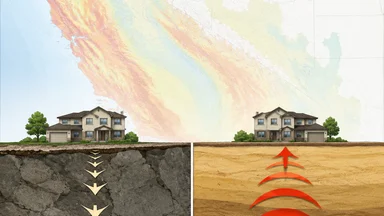
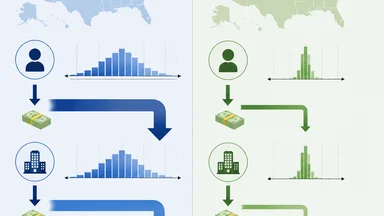
When a homeowner's insurance premium jumps by 20 percent or more, the first question is usually: Why? In flood-prone areas of Texas, North Carolina, and Florida, the answer often lies not in a local flood map update but in the global reinsurance market. Reinsurers—the companies that insure primary insurers—reassess their exposure every January 1 and July 1. They rely on the latest catastrophe models, which may show risks that FEMA's official flood maps have not yet captured. The result is a growing disconnect between what maps say and what policies cost.
Flood Maps Move Slowly; Reinsurance Renews Annually
FEMA's process for updating Flood Insurance Rate Maps is measured in years, not months. The agency typically revises maps every five to ten years, but development and climate patterns can shift faster. A neighborhood built on fill in the 1990s may now be at higher risk due to subsidence or changing rainfall, but the map still shows the old zone. Meanwhile, reinsurance treaties are renegotiated annually, with some carriers opting for mid-year renewals. Primary insurers must price their policies based on the best available data, which increasingly comes from private models rather than public maps.
The timing gap creates a structural problem. When a reinsurer sees modeled flood risk that exceeds FEMA's designation, it demands a higher premium from the primary carrier. That carrier, in turn, passes the increase to homeowners—even though the official map has not changed. Policyholders are left wondering why their rate rose when, according to the government, their flood zone is the same as last year.
Some carriers try to absorb the difference for a renewal cycle or two, but sustained pressure from reinsurers eventually forces adjustments. In 2024, several regional insurers in the Southeast reported that their reinsurance costs had risen by 15 to 25 percent, directly tied to updated flood models. Those costs flowed through to homeowners in the form of higher premiums or reduced coverage options.
The lag also affects new business. An applicant in a zone that FEMA calls low-risk may be quoted a standard rate, but the carrier's internal model may flag it as high-risk, leading to a declination or a surcharge. The consumer never sees the model output—only the final price or denial.
Three States Show the Mismatch in Practice
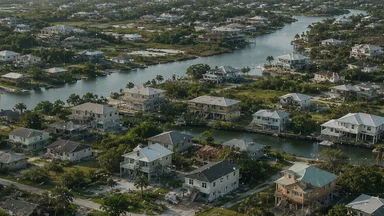
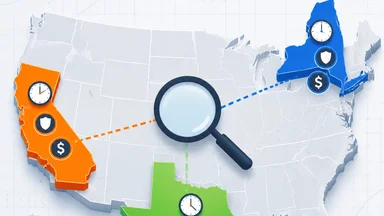
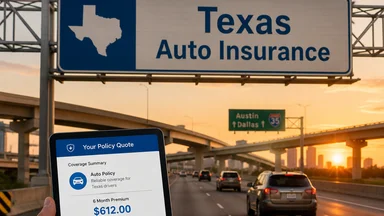
Texas, North Carolina, and Florida each illustrate a different facet of the map lag problem. In Texas, Harris County's flood maps were last revised in 2018. Since then, the county has experienced multiple 500-year flood events, including Hurricane Harvey in 2017 and Tropical Storm Imelda in 2019. Reinsurers now treat much of the county as higher risk than the maps indicate. Homeowners in areas outside the Special Flood Hazard Area have seen premiums climb steadily, even though their FEMA zone status is unchanged.
North Carolina's Outer Banks have not had a major map revision since 2014. That area is vulnerable to storm surge from hurricanes, and reinsurers have updated their models to reflect higher sea levels and more intense storms. Some carriers have responded by requiring separate wind and hail deductibles, or by capping replacement cost coverage. The North Carolina Insurance Commissioner approved an average 8 percent rate increase for 2025, citing reinsurance costs as a key driver.
Florida's Big Bend region saw a partial map revision in 2023, but the data used did not include the 2024 hurricane season, which brought two storms to the area. Reinsurers have already priced in those events, leaving a gap between the official risk and the market's assessment. Some carriers have non-renewed policies in zip codes where the model shows elevated risk, even though the map says otherwise.
In all three states, the mismatch is most acute for homeowners who bought property based on the old maps. They may have chosen a location specifically because it was outside the 100-year floodplain, only to find that their insurance costs now reflect a different reality.
NFIP's Outdated Rate Structure Amplifies the Lag
The National Flood Insurance Program (NFIP) introduced Risk Rating 2.0 in 2021, which prices policies based on individual property characteristics rather than just flood zone. But the underlying maps still reference historical data from the 1970s for some areas. Private reinsurers view NFIP as a lagging indicator of true risk, because it relies on the same slow-moving maps. When NFIP rates rise under Risk Rating 2.0, it signals that the government acknowledges higher risk—but the maps themselves may not change for years.
Congress has not reauthorized NFIP beyond September 2025, creating uncertainty for the entire flood insurance market. Private carriers have stepped in to fill gaps, but they depend on reinsurance to back their exposure. Without a stable NFIP, private reinsurers are even more cautious, demanding higher premiums or stricter terms. Primary insurers then face a choice: raise rates, restrict coverage, or exit the market.
The NFIP's lag also affects the secondary market. Mortgage lenders often require flood insurance in designated zones, but if the map is outdated, a home that should be in a high-risk zone may be allowed to buy a cheaper policy. That underinsurance becomes apparent only after a flood, when the claim falls short of the damage.
Some consumer advocates argue that NFIP should accelerate map updates, but the agency cites budget constraints and the need for local input. Meanwhile, the gap between NFIP pricing and private model pricing continues to widen.
Reinsurers Build Proprietary Models Ahead of Regulators
Firms like RMS and AIR (now part of Moody's) have developed catastrophe models that use real-time elevation data, rainfall records, and climate projections. These models are updated annually, sometimes more often. Reinsurers license them to evaluate their portfolios and set treaty terms. A primary carrier that relies on FEMA maps may find that its reinsurance quote is based on a model that shows a 1-in-50-year flood becoming a 1-in-20-year event in certain coastal areas.
The models are not perfect. They rely on assumptions about future climate that vary between vendors. Some critics say they overestimate risk in areas with good drainage or flood defenses. But reinsurers use them because they are the best available tool for pricing a one-year contract. Regulators, by contrast, move slowly, and their maps are often outdated before they are published.
A concrete example: a Louisiana coastal homeowner saw a 40 percent premium increase in 2024, even though the FEMA map for that parish had not changed since 2016. The carrier explained that its reinsurer had updated its model to reflect subsidence and sea-level rise. The homeowner had no recourse, because the rate was approved under the state's file-and-use system.
Some carriers now disclose the model version used in their underwriting, but that is not standard practice. Policyholders who ask may learn that their rate is tied to a model that differs from the official map. But most consumers do not know to ask, and agents may not have the technical background to explain it.
Carriers Respond with Coverage Restrictions and Exits
Faced with rising reinsurance costs, primary insurers have taken several steps. In 2024, three Florida homeowners insurers reduced wind and hail coverage limits for coastal policies. Others have introduced separate flood deductibles that are tied to the property's elevation as determined by the carrier's model, not the FEMA map. A home that sits five feet above base flood elevation on the map may be modeled as only two feet above, triggering a higher deductible.
Texas saw Farmers Insurance stop writing new policies in 30 coastal zip codes in 2023, citing catastrophe exposure. The company did not specify which models drove the decision, but the affected areas included parts of Galveston and Brazoria counties where FEMA maps had not been updated since 2015. Existing policyholders were not non-renewed, but new buyers had to seek coverage from the Texas FAIR Plan or surplus lines carriers at higher rates.
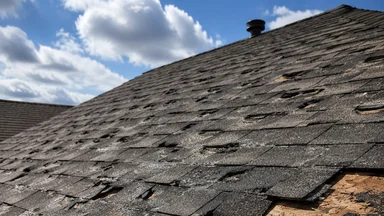
In North Carolina, the Insurance Commissioner approved an average 8 percent rate increase for 2025, with some coastal areas seeing double-digit hikes. The commissioner's order noted that reinsurance costs were a primary factor, even though the state's flood maps had not changed. Some carriers have also started offering only actual cash value on roofs in high-risk zones, meaning a policyholder with a 15-year-old roof would receive only its depreciated value after a claim.
These restrictions create a patchwork of coverage that is hard for consumers to compare. A policy from one carrier may include flood coverage through a separate endorsement, while another excludes it entirely. The decision often depends on which reinsurance treaty the carrier secured, not on the individual property's risk.
Policyholders Face Unclear Choices at Renewal
When a renewal notice arrives with a higher premium and no local map change, the policyholder's first instinct may be to shop around. But comparing quotes is difficult because each carrier uses a different model and may have different reinsurance arrangements. An agent can explain that the increase is driven by reinsurance costs, but that explanation may not satisfy a consumer who sees no physical change in their neighborhood.
One option is to consider a mutual insurance company, which may have more stable reinsurance arrangements and a longer-term perspective. Mutuals are owned by policyholders, not shareholders, so they may be less likely to raise rates sharply in response to a single model update. However, mutuals are not immune to reinsurance market cycles, and their rates may still rise over time.
Another option is to buy a separate flood policy through the NFIP or a private carrier. A standalone flood policy can fill gaps in a homeowners policy that excludes flood, but it adds cost. The NFIP policy uses the same outdated maps, so it may be cheaper than the flood coverage embedded in a private homeowners policy, but it also may provide less coverage. Private flood policies often use the same models as reinsurers, so they may be priced closer to the true risk.
Policyholders should ask their carrier which catastrophe model version was used to set their rate. Some carriers will provide this information upon request. If the model is newer than the FEMA map, the consumer can at least understand the rationale. But few consumers know to ask, and agents may be reluctant to share details that could be seen as proprietary.
Ultimately, the gap between map and model is a structural feature of the current system, not a bug. Until maps are updated more frequently—or until regulators require carriers to disclose model inputs—homeowners will continue to face surprises at renewal.
Regulators Begin to Question the Timing Disconnect
State regulators are starting to push back. In 2024, the Texas Department of Insurance requested map-adjustment schedules from the top 20 homeowners carriers in the state, asking them to explain how they reconcile their internal models with FEMA maps. The goal is to identify cases where rate increases are based on models that diverge significantly from official designations. Some consumer groups have argued that such divergence should trigger a review of the map itself.
Florida's Office of Insurance Regulation now audits catastrophe model inputs annually for all carriers writing more than a certain volume of coastal business. The audits check whether the model version used matches the one filed with the state. If a carrier uses a model update without filing it, the rate may be challenged. This has led some carriers to delay adopting new model versions, creating a lag of their own.
In North Carolina, the Insurance Commissioner wrote to FEMA in March 2025 urging the agency to accelerate map updates for the Outer Banks and other high-risk areas. The letter noted that the state's rate approval process relies on the best available data, and that outdated maps create an unfair burden on policyholders who cannot see the underlying risk.
At the national level, the National Association of Insurance Commissioners formed a flood-risk data working group in 2024 to develop best practices for incorporating model data into rate filings. The group includes regulators from coastal and inland states, as well as representatives from FEMA and the reinsurance industry. Early discussions have focused on transparency: should carriers be required to disclose the model version and key assumptions to regulators? Should consumers have access to a simplified summary?
If maps eventually catch up to the models, the result could be retroactive premium adjustments or legislative relief for policyholders who paid higher rates based on model output that was later validated by an official map change. Some states are considering laws that would require carriers to refund the difference if a map revision shows that the old model overestimated risk. But such laws are politically contentious, and the insurance industry argues that models are forward-looking, not retrospective.
The disconnect between flood maps and reinsurance renewals is unlikely to disappear soon. But as regulators gather more data and consumers become more aware, the pressure to align the two systems will grow. For now, homeowners in flood-prone areas should expect continued volatility in their premiums and coverage options, and should ask questions before assuming their rate reflects the official map.
This article is for informational purposes only and does not constitute professional insurance advice. Policyholders should consult a licensed agent or broker for guidance specific to their situation.